
Share of Model Voice: What It Is and How to Read It (with Contadu Reporting)
Semantic Summary
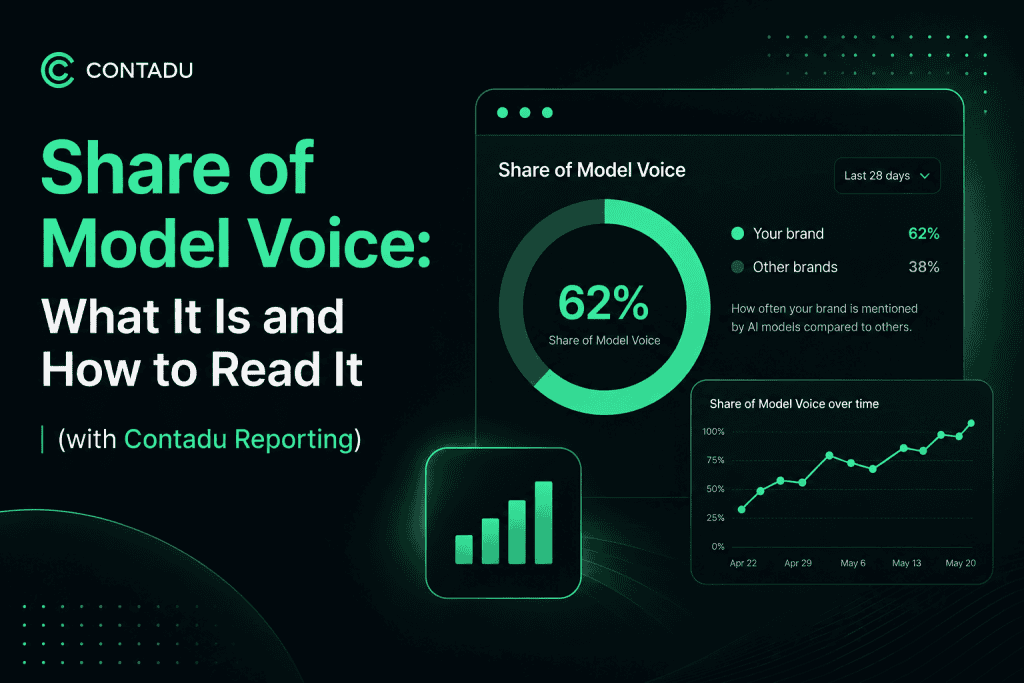
Idea: Share of Model Voice (also written as AI Share of Voice or AI SOV) is a brand visibility metric that measures how often an AI model mentions your brand versus competitors when it answers a category-relevant question.
Challenge: most teams still report on pageviews and keyword rank, which say nothing about whether ChatGPT, Perplexity, Gemini, Claude or Google AI Overviews ever mention the brand at all.
What this article covers: what the metric actually measures, how to calculate it for a real query set, what a good benchmark looks like, and how to turn a weak score into a content plan inside Contadu Reporting.
Share of Model Voice is the percentage of relevant AI-generated responses in which your brand appears, measured against how often competitors appear for the same set of prompts. If your brand is mentioned in 3 out of 10 AI responses about “content intelligence platform,” the metric for that query is 30%.
What Share of Model Voice actually measures
The concept is borrowed from a much older idea. Share of voice has been used in PR, paid media and traditional SEO for decades to describe how much of a conversation or a market a brand controls relative to competitors.
This metric asks the same question of a large language model instead of a search engine results page or a media landscape: out of every relevant question someone asks an AI platform, how often your brand shows up in the response?
This matters because a growing share of research and comparison shopping now happens entirely inside a chat interface, with no click, no ranking position, and no traditional analytics event to capture it.
A page can rank on page one of Google Search and still be entirely absent from an AI-generated response, because ranking and citation increasingly follow different rules across AI models.
Share of Model Voice vs. traditional Share of Voice
Traditional share of voice is measured against search rankings, ad spend or media mentions channels where a brand’s visibility is countable and largely static once a campaign runs.
It is measured instead against what an AI model actually generates in response to a query, which can shift as the model’s training data, retrieval sources and grounding change.
That’s a meaningfully different measurement problem: you’re not just tracking position, you’re tracking whether a language model decided your brand was relevant enough to mention at all and whether that AI-driven mention was accurate.
| Traditional Share of Voice | Share of Model Voice |
| Measured against search rankings, ad impressions, or media coverage | Measured against what an AI model generates in its response to a query |
| Position-based (rank 1 vs. rank 10) | Mention-based (cited or not cited, and how prominently) |
| Relatively stable once a page ranks | Can shift as a model’s grounding sources and training data update |
| One search engine, one ranking | Multiple LLMs (ChatGPT, Perplexity, Gemini, Claude, Google AI Overviews), each with a different AI visibility score for the same query |
How to calculate your Share of Model Voice
Most teams that measure AI search visibility for the first time treat this as a spreadsheet exercise before investing in a dedicated tracking tool, and that’s a reasonable place to start.
The basic formula is simple: take the number of AI responses in which your brand is mentioned, divide by the total number of relevant queries checked, and multiply by 100.
Share of Model Voice = (Number of responses mentioning your brand ÷ Total relevant queries checked) × 100
To measure this reliably, log every brand mention you find, note whether your brand appears early or late in the response, and keep the raw counts alongside the percentage so you can audit the number later.
In practice, calculating this well takes a bit more discipline than the formula suggests:
- Define a real query set first. Don’t just run your brand name as a single query run the actual questions a buyer would ask (comparison prompts, “best tool for X” prompts, category-definition prompts), the same way you’d build a keyword list for SEO.
- Check more than one AI model. ChatGPT, Perplexity, Gemini, Claude and Google AI Overviews are each trained and grounded differently, so a brand can have strong visibility in one and near-zero brand visibility in another. Treat multi-model tracking as the baseline, not an upgrade.
- Read sentiment, not just frequency. Being mentioned inaccurately or negatively in an AI response can do more damage to your brand’s visibility than not being mentioned at all a raw mention count without a sentiment check is an incomplete picture.
- Re-run the same query set over time. A single snapshot tells you where your visibility stands today; re-checking monthly or per publishing cycle tells you whether your content is actually moving the number.
Why marketing and content teams are adopting this metric
Generative AI has moved a meaningful share of information retrieval away from a list of ranked links and into a single synthesized answer.
That shift matters for marketing teams specifically: a citation inside an AI response carries a different kind of trust than a paid placement or a ranked listing, because the model is presenting it as a fact rather than a sponsored result.
Benchmarking your citation rate against competitors is quickly becoming as routine for marketing teams as rank tracking was for classic SEO.
What’s a good Share of Model Voice?
Some AI visibility tools publish industry-wide benchmark tables, but treat these as rough orientation only a market share figure that looks strong in one report can look mediocre once you narrow it to your exact competitor set and your own priority queries.
There’s no single universal benchmark for AI brand visibility — a “good” score depends heavily on your category, how many competitors are being asked about, and how many LLMs you’re averaging across. A niche B2B category with three real competitors will naturally produce a higher achievable score than a broad consumer category with dozens of brands competing for the same queries.
Instead of chasing an absolute benchmark or a fixed market share figure, track your own brand performance trend against your closest competitors on the same query set a rising line is the more reliable signal for brand visibility than any single fixed figure.
What moves your Share of Model Voice
A handful of factors consistently show up across how AI-driven models decide what to cite or mention in a response:
- Clear, extractable content. A model needs a clean, quotable statement to lift into a response vague or heavily marketing-toned copy is harder to cite than a direct, specific claim.
- Consistent entity signal. Being named alongside a topic in multiple independent places not only on your own site reinforces that your brand and that query belong together, which strengthens your standing across AI models over time.
- Terminology match. Using the same language your audience actually types into a query (rather than internal jargon) makes it easier for a model to connect your content to that query.
- Freshness. Outdated pages are less likely to be pulled into a current response, especially for fast-moving topics and queries.
- Technical basics. None of the above matters if the page isn’t crawlable and indexable in the first place the fundamentals of SEO still apply underneath GEO and AEO work.
From a weak score to a content brief: how Contadu Reporting closes the loop
A score by itself doesn’t fix anything — the useful step is turning a weak score on a specific query into a scoped piece of content. In practice that means asking three questions for any query where your brand’s visibility is low:
- Do we have one page that directly and clearly answers this query, structured so a model can extract a clean statement from it?
- Is our brand mentioned alongside this topic anywhere else guest content, PR, community discussion or does our own site carry the entire visibility signal alone?
- Are we using the terminology real buyers and models actually use in a query, or internal language that doesn’t match it?
This is exactly where Contadu’s Reporting module is built to help: instead of a visibility score sitting on its own dashboard, disconnected from the rest of your workflow, it connects back to the same Content Strategy gap-analysis view used to plan the article in the first place. A weak query in your reporting turns directly into a scoped brief inside the same platform not a separate audit you have to reconcile by hand.
A practical first workflow
For a team tracking this for the first time inside Contadu, a simple starting workflow for reading your brand visibility looks like this:
- Pick 10–15 questions tied to real buying decisions not your entire content library, just the prompt set that matters to revenue.
- Set a baseline reading across the AI models that matter to your audience before changing anything.
- Cross-reference the weakest questions against your existing Content Strategy gap analysis to see whether the gap is a missing page, a weak page, or a missing external mention.
- Re-run the same query set after your next publishing cycle and read the movement, not the single snapshot, as the real visibility signal.
FAQ
What is Share of Model Voice?
Share of Model Voice (also called AI Share of Voice or AI SOV) is a brand visibility metric measuring the percentage of relevant AI-generated responses in which your brand is mentioned, measured against how often competitors are mentioned for the same query set.
How is Share of Model Voice different from traditional Share of Voice?
Traditional share of voice is measured against search rankings, ad spend or media coverage. Share of Model Voice is measured against what an AI model actually generates when answering a query, which follows different retrieval and citation mechanics than classic ranking or media reach.
How do I calculate my Share of Model Voice?
Divide the number of AI responses that mention your brand by the total number of relevant queries checked across a defined query set, then multiply by 100. The reliability of the number depends on using a realistic query set and checking multiple LLMs rather than just one.
What’s a good Share of Model Voice percentage?
There’s no single universal benchmark it depends on your category, how many real competitors you’re being compared against, and how many AI models you average across.
Track your own visibility trend over time against close competitors rather than chasing a fixed target number.
Does Share of Model Voice correlate with revenue?
It’s an early-stage proxy for buyer consideration rather than a direct revenue metric on its own being recommended by an AI model during research is a meaningful visibility signal, but it should be read alongside your existing pipeline and conversion data, not as a replacement for them.
Do I need to track every AI model, or is ChatGPT enough?
Checking only one model gives an incomplete visibility picture, since ChatGPT, Perplexity, Gemini, Claude and Google AI Overviews are each trained and grounded differently and can produce very different mention rates for the same query. Multi-model tracking across LLMs is the realistic baseline, not an advanced add-on.
Can I track Share of Model Voice inside Contadu?
Yes Contadu Reporting module is built to connect this kind of AI visibility metric directly back to the Content Strategy gap-analysis view, so a weak result on a query turns into a scoped content brief rather than sitting as a standalone number on a dashboard.
How often should I re-check my Share of Model Voice?
Treat it as a trend rather than a daily metric checking monthly or per publishing cycle is usually enough to see whether new or updated content is moving your brand visibility, since LLMs don’t re-ground their responses instantly after you publish.
Does Share of Model Voice replace traditional SEO metrics?
No it sits alongside them. A page can perform well in traditional SEO rankings while showing weak brand visibility in AI responses, because Google’s rankings and what an LLM chooses to cite for the same query don’t always overlap.