

Blog Post Heatmap Analysis: How to Read Scroll and Click Patterns
Semantic Summary
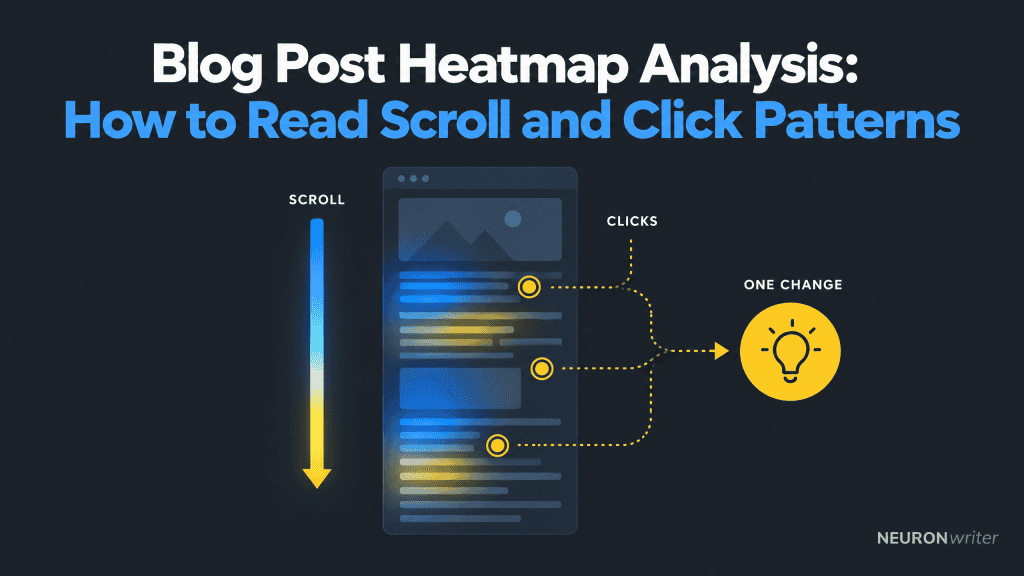
Idea: A blog post heatmap can show where readers scroll, click, or pause, helping a team spot places worth investigating.
Challenge: A colored area is a record of aggregated behavior, not an explanation of what a reader thought or why they left.
Summary: Start with a clear question, compare scroll and click patterns in context, and turn one credible observation into one measurable content change.
Related Reads
- GA4 for Content Marketing: A Practical Setup and Reporting Guide
- Blog CTA Testing: A/B Test Calls to Action Without Hurting the Reader Experience
| Step | Question | Useful next move |
| 1. Define | What content decision do we need to make? | Choose one post and one reader question |
| 2. Observe | Where do readers scroll and click? | Review scroll and click maps by device and page context |
| 3. Interpret | What else could explain this pattern? | Check traffic source, page purpose, links, and layout |
| 4. Improve | What single change could help? | Make one edit and compare the intended next action |
A blog post heatmap is most useful when it answers a specific question about reader reach or interaction. It guides investigation; it does not replace editorial judgment or outcome measurement. The aim is to improve the content layout and help readers complete the task that brought them to the article, not to make everyone scroll farther.
What a Blog Post Heatmap Shows and What It Cannot Tell You
A website heatmap (also written “heat map”) visualizes recorded interactions. Depending on the type, it can show where visitors click, how far they scroll, or where pointer activity occurs. The scale summarizes activity; check how the heatmap tool collects and displays data. A map can help inspect user behavior patterns, but cannot read individual minds.
A scroll map helps you see how far readers progress down an article. Click maps show where users click, including links, buttons, and sometimes non-interactive elements.
Hover maps record pointer movement, which can offer clues on desktop but is not eye tracking. Attention heatmaps may use eye-tracking or predictive methods, so check what the heatmap tool actually measures. These different types of website heatmaps capture different signals; one type cannot answer every question.
Heatmap data does not directly reveal attention, understanding, satisfaction, or intent. A reader may stop because they found the answer, struggled with the page, or were interrupted. A link click does not prove the destination helped. Treat each pattern as a clue and check another source before drawing a conclusion.
Choose the Right Map for the Question
Choose the map that matches the decision you need to make. Use scroll data to investigate content reach, click data to investigate interaction with page elements, and pointer movement only as a limited supplementary signal.
- Scroll map: Are readers reaching the answer, example, or related section?
- Click map: Are readers using the internal links or calls to action that appear relevant?
- Hover or movement map: Are desktop users moving the pointer around an area that may need closer review?
Start with “What would we change if we saw a meaningful pattern?” If no observation could affect the article, the analysis may not be worth setting up. Heatmaps use data visualization to summarize aggregate data; a bright cluster does not mean every visitor behaved the same way.
Color is a visual aid, not a conclusion. Heatmap palettes and scales vary: warmer colors may mark more activity and cooler colors less, but verify the legend rather than assuming a universal rule.
W3C guidance says color should not be the only visual means of conveying information. When sharing findings, pair color with labels or a written description so people can understand the pattern without relying on color perception alone.
Set Up a Useful Heatmap for a Blog Post
A useful setup begins with one page, one question, and a defined observation period. You do not need a map for every article; choose pages where the decision matters and where enough representative visits can accumulate to make the pattern worth reviewing.
- Select a decision-worthy post. Pick an article with a clear job: answer a recurring question, help readers compare options, or guide them to a relevant next resource.
- Write the question first. For example: “Do mobile readers reach the troubleshooting section?” or “Are readers clicking the source links that support this claim?”
- Record the page context. Note the article version, approximate dates, promotion or campaign activity, and any page changes during collection.
- Check device and layout differences. Review mobile and desktop separately when possible. Responsive layouts, sticky elements, embedded media, and page length can change what a map represents.
- Use responsible data collection. Check your privacy, consent, and data-retention settings against your organization’s policies and applicable requirements. Avoid collecting information that identifies a person when it is not needed.
Collect and compare heatmap data carefully
Before collecting data, note the article version, page layout, device category, traffic source, and dates. If the page changes while data is being collected, record when the change happened; otherwise the map may combine different experiences. Heatmap analysis works best when each data set represents a comparable page state and audience.
When you make an edit, compare maps from similar periods and devices, then check a separate metric tied to the intended outcome. Heatmaps provide a visual account of where users interact; analytics can provide counts and completion events, while reader feedback can add qualitative context. These sources answer different questions, so combine heatmaps rather than asking one map to explain the whole user experience.
Real-time data can help identify an implementation problem soon after a change, but a short window may not represent normal behavior. Use it for a quick technical check, then review a more representative period before deciding whether the content change worked.
There is no universal traffic number that makes a heatmap reliable. The evidence you need depends on audience variation, page traffic, and the decision at stake. If visits are sparse or concentrated in one campaign, call the result directional. Do not transfer a product page benchmark to a long blog guide.
Read the Scroll Map Before Changing the Article
Read a scroll map by comparing reader reach with the article’s purpose and structure. Look for where reach changes, then inspect the content at that point; do not assume the section above a drop-off is necessarily weak.
Start at the top and follow the page downward. Ask whether the opening makes the article’s value clear, whether headings describe what follows, and whether a major answer appears before or after the point where many readers stop. If a key answer is deep in the post, consider whether a concise answer or summary belongs earlier while the detailed explanation remains below.
Look for a “false floor,” a layout cue that makes a page seem finished when more follows. A large gap or heavy embed may create this impression. Inspect the page on the affected device before changing copy; the map shows where scrolling falls, not what caused it.
Compare like with like. A search visitor looking for a quick definition may behave differently from a subscriber reading a long guide. Mobile readers may encounter a different sequence of content than desktop readers. Segment the data when useful, but do not create groups so small that patterns become unstable.
Do not treat maximum scroll depth as the goal for every post. If a short article answers the reader’s question near the top, a quick exit may be a successful visit. The right question is whether readers can find and use what the page promises—not whether they consume every paragraph.
Read Click Maps for Links, Images, and Calls to Action
A click map helps you inspect whether useful page elements receive interaction. Compare clicks with the reader journey: internal links, citations, images, and calls to action should each have a clear purpose.
Look for unexpected clicks. Repeated clicks on an unlinked image may mean readers expect it to open or explain something; clicks on a heading may expose an unclear cue. Check whether adding a link would help and make its destination clear. A click map shows user clicks, not whether the element delivered value.
A call to action click is only one step; it does not show that a visitor completed a form or found the offer useful. A heatmap cannot calculate conversion rate by itself. Pair it with an outcome metric and a check of the destination. Heatmaps show where users click; only a separate measure can confirm completion. A change in bounce rate is a metric to investigate, not a diagnosis. For CTA testing, see the guide to blog CTA testing.
Analytics events are also different from a visual heatmap. Google Analytics documents its enhanced measurement “scroll” event as firing the first time a user reaches 90% vertical page depth.
That answers whether a threshold was reached, but not how far different readers scroll or where reach changes between sections. A web analytics tool provides a metric; a scroll map visualizes the distribution. Use the measurement that answers your question, not a single event as a substitute for the full map.
Six Patterns Worth Investigating
Use this table as a starting point for questions, not as a diagnostic scorecard. Each pattern has several possible explanations, so verify the page and audience context before editing.
| Observed pattern | Possible explanation | What to check next |
| Many readers stop near the opening | The answer may be quick, or the opening may not match expectations | Compare search intent, opening promise, and next-step behavior |
| A key section sits below typical reach | The article may bury a useful answer or simply serve a narrow follow-up need | Review headings and consider moving a concise answer upward |
| A CTA receives little visible interaction | It may be below reach, unclear, or unnecessary for the page | Check whether readers reach it and whether the offer fits the article |
| An image gets clicks but opens nothing | The image may look interactive or prompt a request for more detail | Inspect the visual cue and add a useful destination only if warranted |
| Mobile and desktop patterns differ | Layout, reading context, or traffic source may differ | Inspect responsive rendering and compare similar visitor groups |
| Clicks occur without a next action | The destination may not meet expectations, or the click may be accidental | Review the destination promise and measure completion separately |
Heatmaps can help show where users engage, but they do not establish cause. A low click rate could reflect an unclear link, a reader who already has the answer, or an irrelevant offer. Test one explanation before redesigning the article. In conversion rate optimization (CRO), a heatmap is an investigation aid not proof that a change will improve results.
Turn One Observation into a Controlled Content Improvement
Turn one observation into one testable change. Keep the original question and the article’s purpose in view, then track whether the change improves the next useful action without creating a new problem.
- Describe what you saw. Write an observable statement, such as “Few mobile visitors reach the comparison table,” rather than “Mobile readers dislike this post.”
- List plausible explanations. The table may be too far down, the page may be long, or the search query may call for a quick answer. Avoid choosing one cause before checking.
- Choose one change. You might move a short summary higher, clarify a heading, or make a relevant text link easier to recognize.
- Define a success signal and a guardrail. Track the action the change is meant to support, and watch for a downside such as a confusing destination or a harder-to-read layout.
- Review comparable evidence. Account for device, source, campaign, and page updates. Record whether the evidence is strong, directional, or inconclusive.
Keep a short change log: page, observation, hypothesis, edit, date, measure, result, and next decision. If the result is inconclusive, retain that learning rather than announcing a winner. A later review may need more observations or a clearer test.
Heatmap analysis complements, rather than replaces, content measurement. The GA4 guide for content marketers explains how event and page reports can support decisions about what happens after a reader reaches or clicks a page element.
Common Heatmap Analysis Mistakes
The most common mistake is treating a color pattern as proof of what readers wanted. Use these practices:
- Reading colors without the legend: heatmap tools can use different scales and measures. Check what is counted before interpreting “hot” or “cold.”
- Mixing devices and layouts: a combined map can hide mobile-specific issues or differences in how a page renders.
- Overreacting to thin data: one unusual source or small group can dominate a map. Describe uncertainty and gather more evidence if the decision is consequential.
- Changing several elements at once: if the pattern changes afterward, you may not know which edit mattered.
- Equating clicks with conversion: a click is an interaction, not proof of a completed goal or a satisfied reader.
- Optimizing for scroll depth alone: readers may get the answer early. Make the content useful, not artificially longer.
When a heatmap shows a surprising pattern, inspect the page and compare it with another signal, such as an event, reader question, search query, or support feedback. Combine quantitative and qualitative data; raw data alone rarely explains a behavior.
How Contadu Supports the Content-Planning Work Around Heatmap Findings
Contadu’s Content Strategy features support topic planning, keyword clustering, and identifying content gaps. Those functions can help a team decide whether a heatmap observation points to a missing supporting article, an unclear topic relationship, or an opportunity to improve the content plan.
They do not provide session-level heatmap tracking or explain an individual visitor’s behavior. Use a suitable analytics method for observed interactions, follow your privacy requirements, and bring the resulting editorial question into the planning workflow. See Contadu Content Strategy for the product’s planning and topic-coverage scope.
FAQ
What does a blog post heatmap show?
A blog post heatmap visualizes clicks or scroll reach across visits. It can locate areas to check, but does not directly reveal attention, comprehension, or intent.
How do you read a scroll map for a blog post?
Compare reader reach with the article’s purpose and section order. Look for changes in reach, then inspect the content and layout around those points, separating devices or traffic groups when the evidence allows.
How much traffic does a blog post heatmap need?
There is no universal minimum. Needed volume depends on audience variation, page traffic, and the decision’s impact. With limited or unusual traffic, treat the result as directional.
Should I analyze each blog post separately or group them?
Analyze an individual post when the question concerns its layout. Group posts only when they share structure and purpose; mixing unlike formats can hide differences.
Is a scroll-depth event enough to replace a scroll map?
Not usually. A threshold event can tell you that a visitor reached a defined point, while a scroll map can show a broader distribution of reach across the page. Use the measure that matches the question, and remember that neither explains why someone stopped.
Can heatmaps show why readers leave a post?
No. They show where recorded activity declines, but several explanations may fit. Check the opening promise, layout, traffic source, device, and feedback before changing the post.
How should I use heatmap findings to improve a blog post?
Record one pattern, consider alternatives, and make one change tied to the page’s purpose. Define a next-action measure—such as whether readers open a useful related resource—and a reader-experience guardrail. Review comparable evidence before keeping or reversing the edit.
